Plotting a cluster to a waveform chart will automatically generate the correct number of stacked plots on your front panel. You can create a cluster from multiple points using the
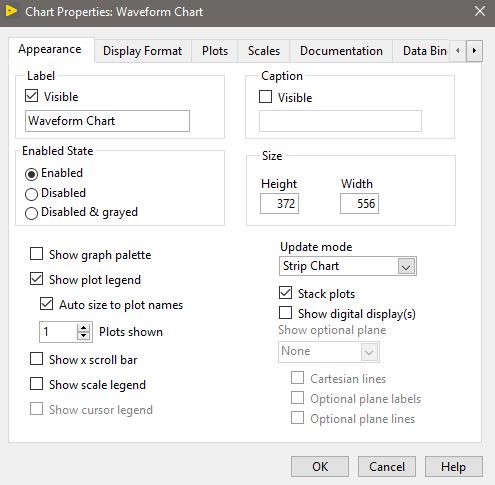
Bundle function. For this to work you have to set the chart on the front panel to stack plots instead of overlaying plots by
Right-Clicking on the Chart >> Properties >> Stack Plots.
It is important to note that since clusters have a fixed size, you would have to manually create a cluster of a different size if you want to change the number of stacked plots on your chart.
Additional Information
You can also use arrays to plot data to a chart with stacked plots. Arrays can have their sizes changed programmatically which would make programmatically adding or removing data sets simpler.
Unlike clusters, arrays will not automatically generate the correct number of stacked plots on your front panel. Manually resizing the plot legend will allow you to change the number of displayed stacked plots.