Solution
Using a LabVIEW NXG graph you can plot numeric, complex or point sample data, the important thing here would be to see how are you mapping the XY elements to the graph indicator.
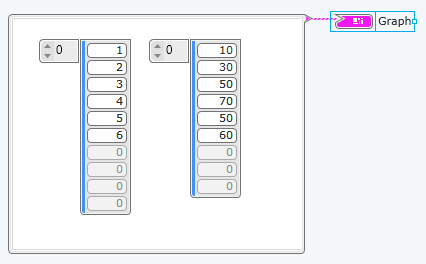
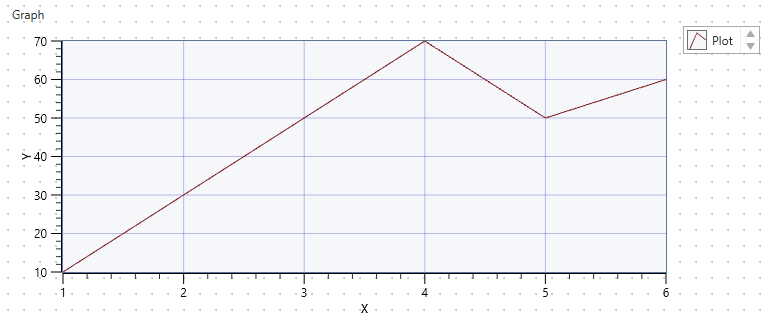
For example, if you create a cluster of arrays you will get this behavior