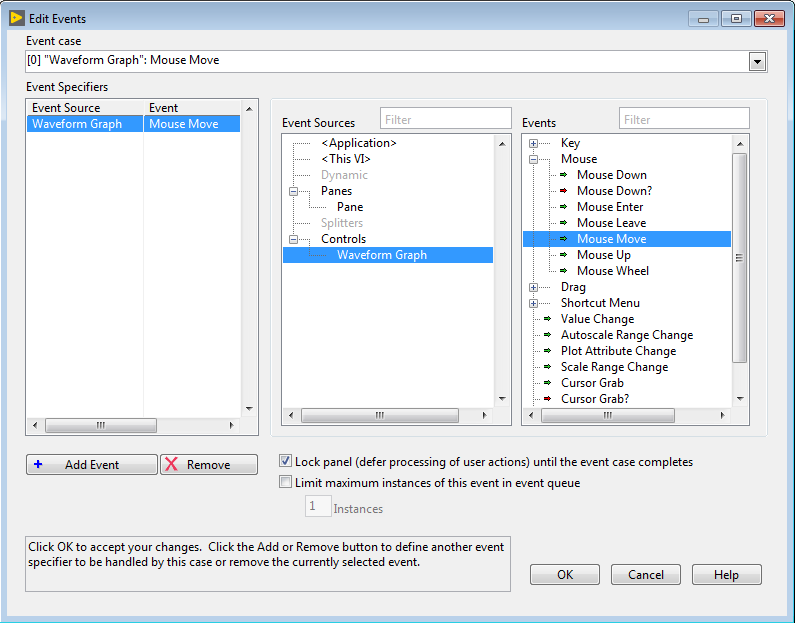
- Create an event structure, select Waveform Graph as Event Source, select Mouse Move as Events, click OK as shown in the figure below.
-
Get the coordinates of the mouse from the event data node by creating an invoke node on the graph at the front panel for Map Coordinates To XY as shown in figure below.
Right click on the Waveform Graph, select Create >> Invoke Node >> Map Coordinates To XY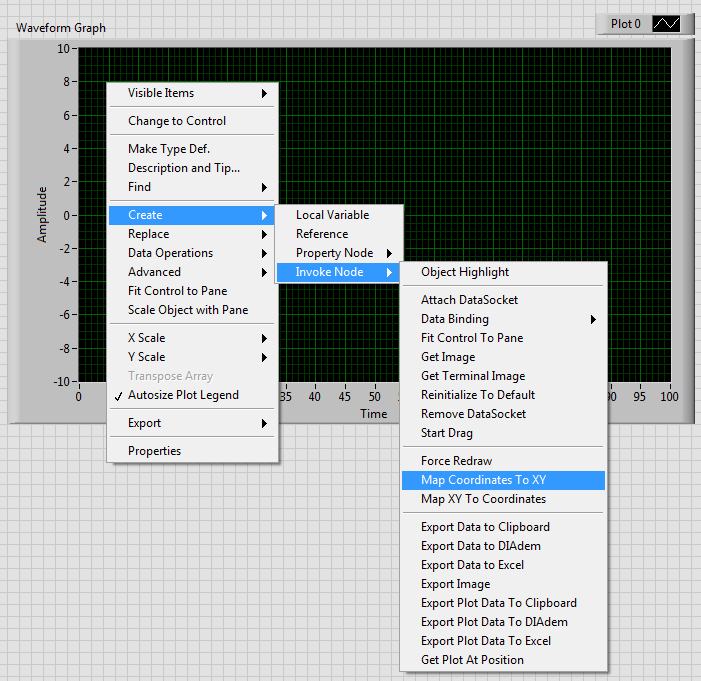
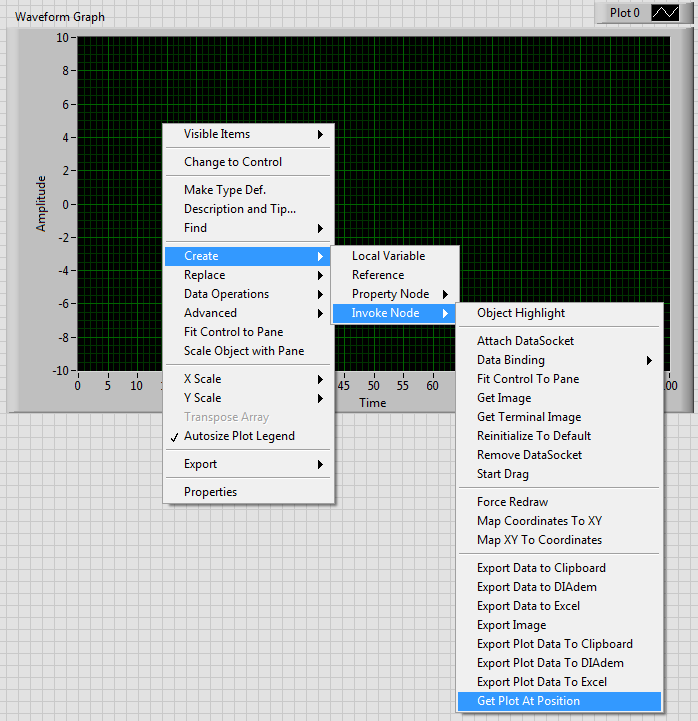
- Create an invoke node on the graph at the front panel for Get Plot At Position as shown in figure below. Right click the on Waveform Graph, select Create >> Invoke Node >> Get Plot At Position
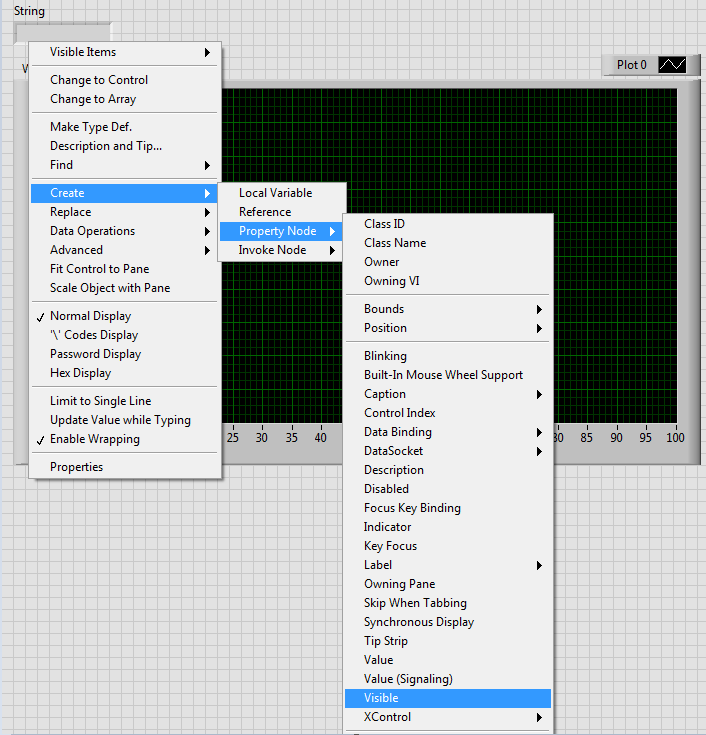
- Create an string indicator and create a Property Node for Visible, Position and Value as shown in figure below. Right click the String Indicator, select Create >> Property Node >> Visible. Repeat the same for Position and Value.
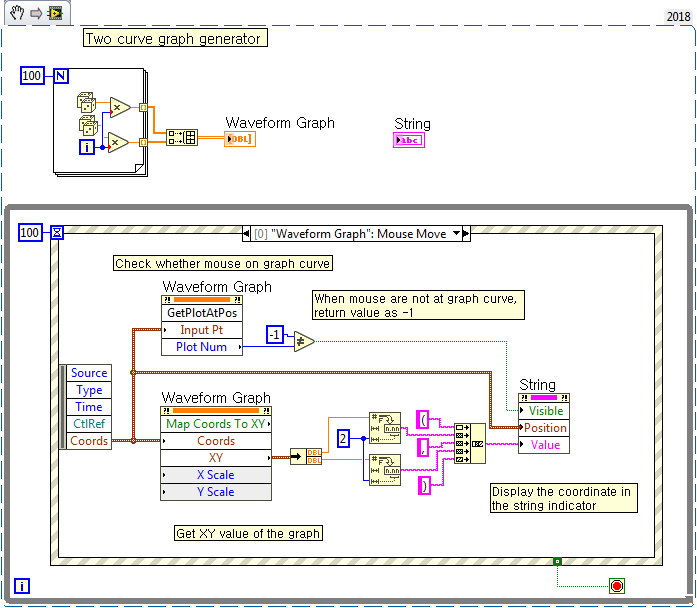
- Wire the Coordinates Data Node from event structure to the input of Map Coordinates To XY Invoke Node. Use Unbundle function to extract the X and Y coordinates value. Convert the value into string format using Number To Fractional String. Display the string indicator when mouse is on the curve of the graph. The block diagram are as shown below.
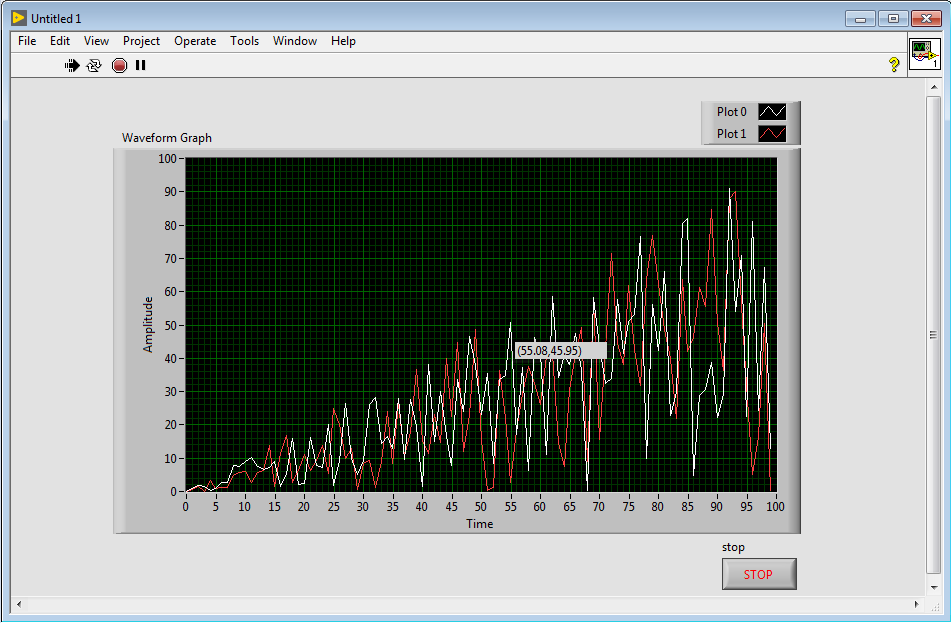
The results are shown below:
Additional Information
We can actually compile the function above as a XControl. So even the VI had stopped executing, user still able to get the coordinates information.
In order to create a XControl, you have to copy the Waveform Graph and the String indicator to the Façade.vi front panel. For block diagram, you need to create a new mouse move event as shown below.
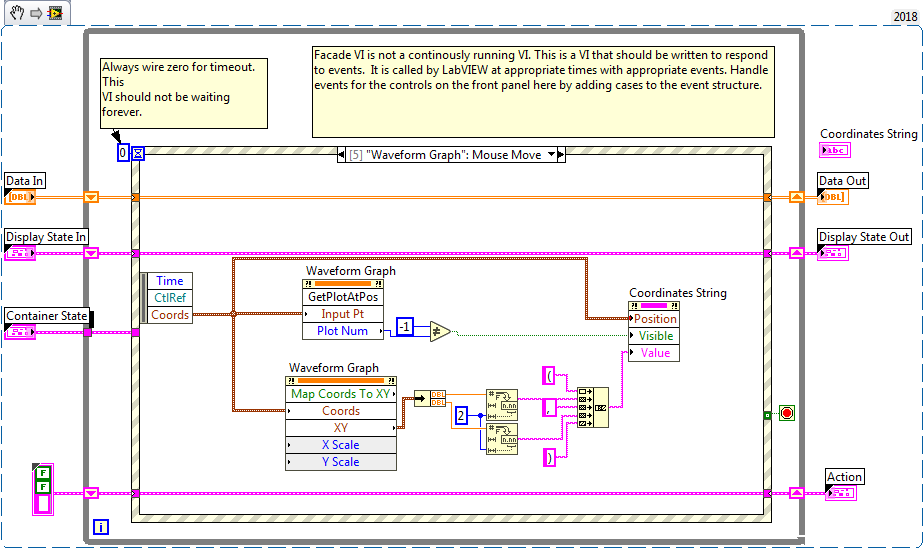
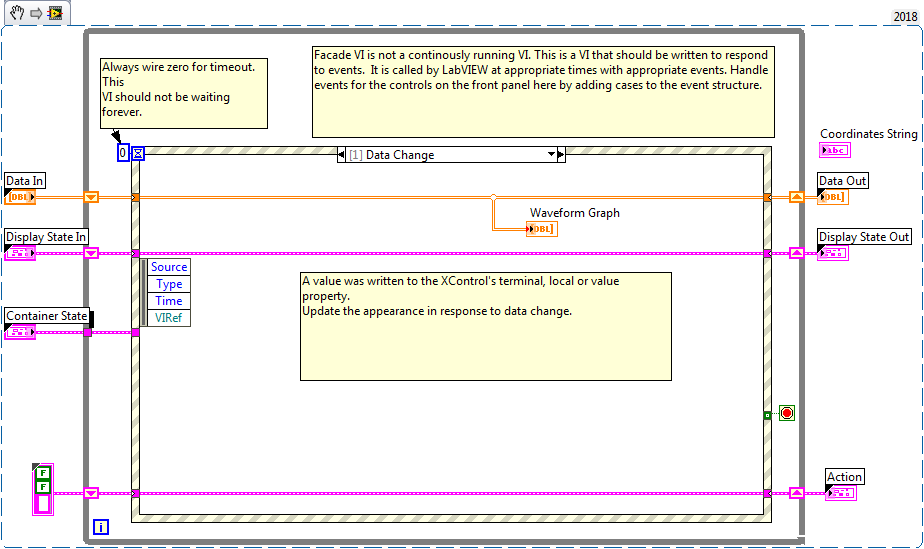
Place the Waveform Graph inside the Data Change event state as below.
