The
DIAdem ANALYSIS channel function
Generate Time Channel will create a Time channel type that contains absolute time.
- Enter the given Start time.
- In this case January 1, 2017 at 3:00 PM (15:00)
- Enter the given Time unit and Time step.
- Time step must be an integer value. In this case, the given sample rate 17.1 Hz time step is 58.4947 milliseconds. We will set Time unit to Microseconds and Time step to 58495.
- Entering a decimal value will give the following error.
- Select the Time domain specification to be Start/Step/Number if you have a set number of points to plot or Start/Step/End if you have an end time for the given test.
- In this case, we will select Start/Step/Number and Number of values as 1024 because we have 1024 data points.
The window will look like the following.
4. Click
OK or
Calculate to create a new Time channel in the default channel group.
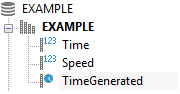
5. Click the new
TimeGenerated Time channel, then click the data channel (in this case
Speed). Drag both into a
DIAdem VIEW or
DIAdem REPORT 2D Axis Systems to plot data over the absolute time.